
Introduction
In our series of papers to date, we’ve looked at elements of cash flow forecasting, including how to arrive at your comfort level of cash – the level in your bank account that you don’t want to fall below, and an approach to cash flow planning. In this fourth and final paper, we’ll now turn to an analysis of a common error made in business management – the equating of profit and cash. Not only that, we’ll look at the impact equating these concepts can have on actual cash flow and, consequently, the comfort level of cash and how dangerous this can be.
We’ll take a simple example and look at it under three scenarios. Don’t be put off by the numbers. What we discuss here is easy to follow, and we present the cash flow impacts graphically as well – anyone can follow a line graph!
Example Data
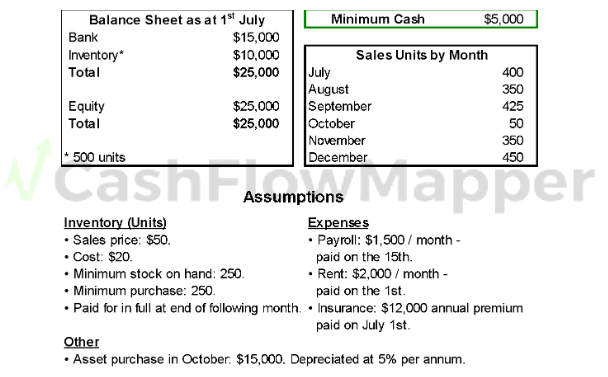
Here’s the data that will be used in our simple example. We’ll prepare profit and cash flow forecasts based on it.
Profit & Loss Statement
Here’s the profit and loss statement for the six months using our data above.
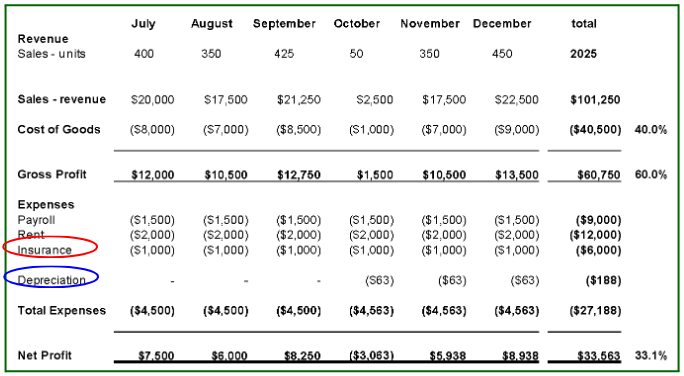
Note the following.
- The treatment of the Insurance as a monthly expense.
- The Depreciation of the asset commencing in October.
Now we are going to show three cash flow scenarios, which will vary by when the sales revenue is received. Again, later we’ll show this all graphically for those with an aversion to numbers!
Cash Flow Scenario 1 – all sales paid for in the month they occur
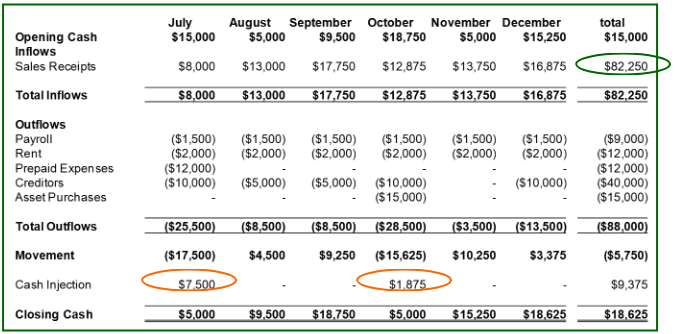
Let’s now see how our scenario looks from a cash flow perspective.
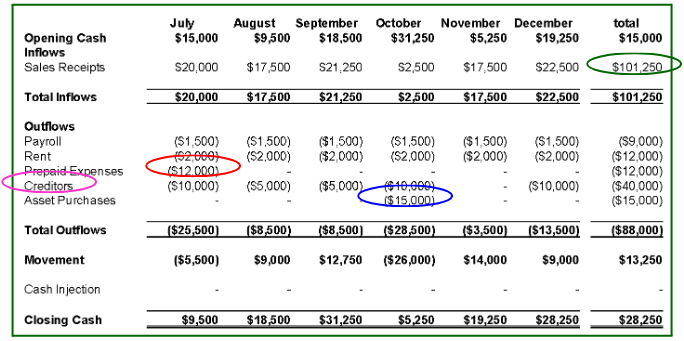
This is a good illustration of the difference between profit and cash flow – note the vastly different bottom lines.
- Sales Receipts are the same as Revenue as cash is received in the month of sale.
- The insurance expense is one cash outflow – Prepaid Expense.
- The Asset Purchase is one cash outflow.
- Instead of the Cost of Goods Sold, we show our payments to Creditors for the inventory.
Cash Flow Scenario 2 – sales receipts: 60% end of month, 30% end of 2nd month, 10% end of 3rd month
Let’s now take a look at a scenario where we have credit sales, a much more realistic scenario for most businesses.
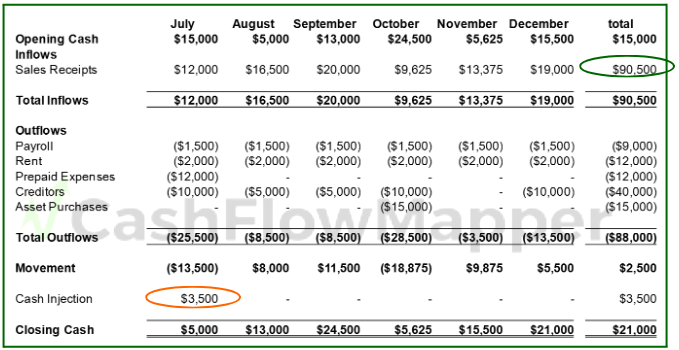
There are two changes from Scenario 1.
- Sales Receipts have decreased each month.
- In order to maintain our minimum (comfort level) cash balance, we had to inject $3,500 into the business.
Cash Flow Scenario 3 – sales receipts: 40% end of month, 30% end of 2nd month, 20% end of 3rd month, 10% end of 4th month
Again, we have only two changes to the same items.
- Sales Receipts have decreased further each month.
- In order to maintain our minimum (comfort level) cash balance, we had to make two cash injections into the business during the six-month period.
Is this a good enough picture of cash flow?
We will now look into our cash flow scenarios a little deeper. While the analyses above give us a good idea, you’ll see shortly that not enough detail is provided. In fact, you really need a daily analysis of cash flow to be fully informed.
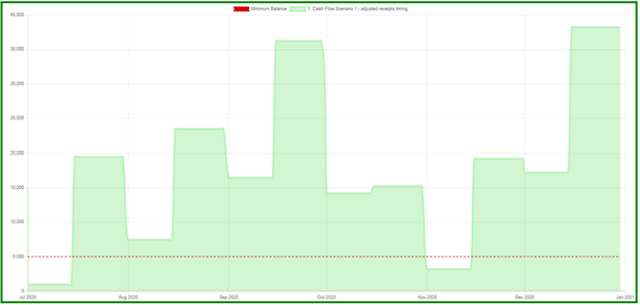
To emphasise the point of needing a daily view of cash flow, we’ve shown Scenario 1 graphically, assuming that all receipts are received on the last day of the month.
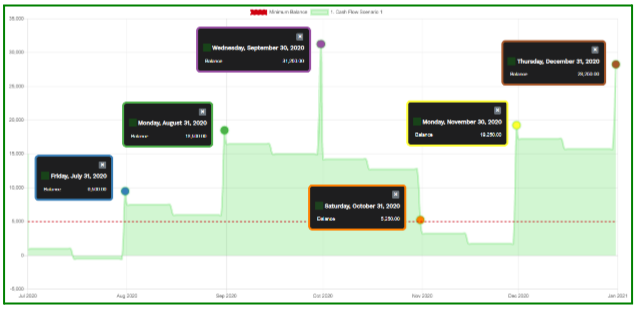
You can see that all the month-end cash balances reflect those shown in the cash flow report shown for Scenario 1 above. However, this may not be enough information. Let’s take the month-end commentary boxes away
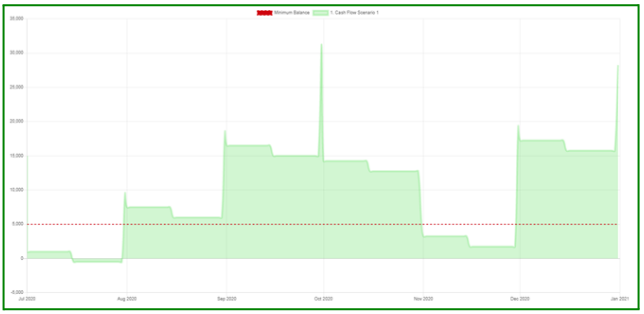
and see that there are two extended periods where we have breached the minimum cash level. By taking a month-end view of cash flow only, we have no idea of the possible emergency awaiting us.
We get the same story numerically (this is the final numerical image for this paper, we promise!).
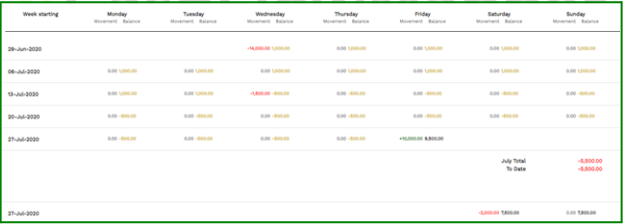
We can see that the insurance and rent payments on the 1st of July put our cash flow under pressure immediately; we don’t get that insight with the monthly summary.
Whichever way we look at it in detail, it’s clear that a monthly summary of a plan or forecast just isn’t good enough, particularly for a short-term (up to 12 months) view.
Now, assuming that all cash receipts occur on the last day of the month only is a little extreme. Let’s make the more realistic assumption that, on average, they are received mid-month. Let’s see what cash flow looks like now.
Even allowing for the averaging of receipts throughout the month, minimum cash is still breached twice.
Now, it’s apparent that if cash inflows were received smoothly during the month, we wouldn’t breach the comfort level of cash – this business generates positive cash flow over our six-month forecasting period. Remember, our cash outflows occur on set days each month, so we need to ensure that we have cash available on those days to cover them. Given that across our forecasting period, we generate the revenue needed to sustain the business. It’s the timing of the cash movements that we need to understand in order to see how our business is travelling.
Just to emphasise this further, let’s look at all three original scenarios simultaneously.
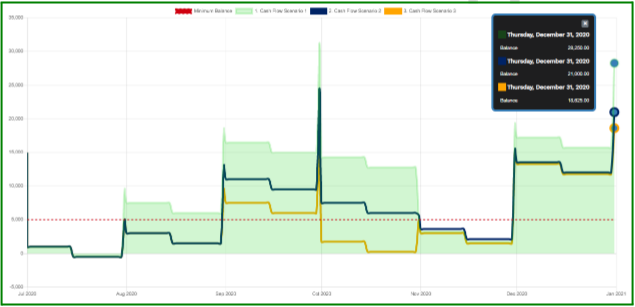
The breaching of minimum cash is greater again in Scenarios 2 & 3. Even though our initial model factored in cash injections so that the month-end cash balance was above $5,000, a more detailed look shows us that this may still not keep us out of trouble.
As you can see, the timing of your cash flows is crucial, as is the understanding of the impact of feasible scenarios.
Summary
What are the learning points of this paper, then?
- Profit and cash are different concepts. Both are important, but not the same.
- The greater visibility of cash flow, the better. A month-end snapshot, particularly when planning or forecasting, is not good enough.
- The timing of cash flows and understanding their impact is crucial. Run feasible scenarios, and prepare an action plan to cope with or take advantage of all of them.
- Take care in determining your comfort level of cash. We wrote a paper about this – The comfort level of cash – we all have one, but what is yours? – a little while ago. Review it and incorporate it into your business. You need to ensure you can take action to avoid breaching it and take advantage of excess cash when you have it. That’s one of the reasons you are in business for!
- The two papers that follow – The comfort level of cash – we all have one, but what is yours? – are Elements 4-6 of Cash Flow, which examine the characteristics of transactions further, and An Approach to Planning & Forecasting Cash Flow, which discusses taking the six elements and using them to produce the cash flow plans and forecasts that your business needs,
CashFlowMapper is a cloud-based cashflow forecasting tool designed so you can understand and take control of your most important asset – cash!
Ideal for advisors, business owners, or finance professionals.